
Improved Analytic Dashboard Search

Published on
11 Sep 2023
The search field in Agvance SKY Analytics now searches across all projects to help you access just the right dashboard. Agvance users welcome this enhancement as the number of dashboards has climbed to over 100 this year and continues to grow.
The large variety of dashboards in SKY Analytics helps businesses utilize Agvance to gauge performance, monitor trends, and view outliers for easy comparisons. Using visualizations, charts, and graphs, analytic dashboards are key to making data analysis a part of daily business management. The dashboards are subdivided into project areas including Accounts Receivable, Admin, Agronomy, Customer, Energy, Grain, Ledger, Logistics, Mapping, Patronage, Product, Vendor and Company Content. Data can be viewed from either a summary or detailed level with the ability to easily drill down or roll back.
Searching in Analytics
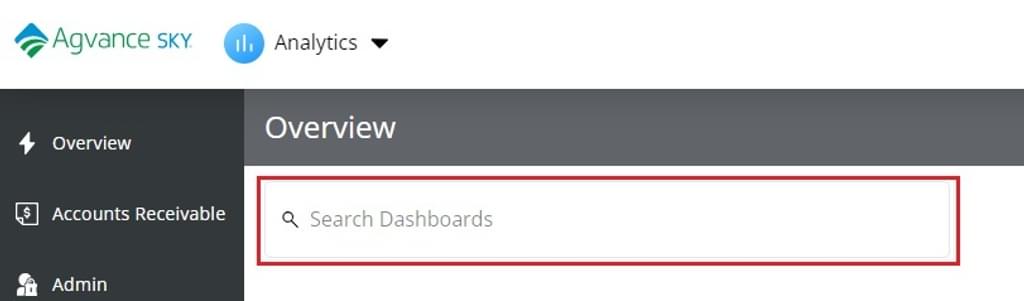
To use the improved search feature, type in the “Search Dashboards” box from any page in SKY Analytics and search results display dashboards from any project category. To return to a dashboard often, click the star to save it as a favorite. Favorite dashboards will be available on the Overview page along with recently added dashboards.
Resources to Learn More about Agvance Analytics
Multiple learning opportunities are available from Agvance University. These lessons and courses help you learn to create new dashboards or customize predefined dashboards and easily export and share data with your team.
New! Analytics eLearning Series (self-paced)
This new series of eLearning lessons specifically about Analytics has recently been added! All eLearning lessons can be completed on-demand at your own pace and explain concepts and include questions to ensure the learner understands the information. View the full list of eLearning Courses including Analytics 101 and Analytics 201.
Web Authoring Course (instructor-led)
Analytics Authoring is a web-based report tool that allows users to edit and build dashboards that will answer their unique business questions. In this course, users will learn how to use this powerful tool to edit Analytics standard dashboards to make them more relevant to their company as well as design new dashboards using our established data sources. The course includes classroom instruction with hands-on exercises to reinforce the concepts. Analytics Web Authoring Course Information
For additional information, review the resources included in the Analytics Educational Pathway on the Agvance Help Center and the Agvance Analytics product summary on our website.